NCL Infrastructure
This document outlines the architecture, design, and implementation of the NCL application. It is intended for use by any relevant stakeholders.
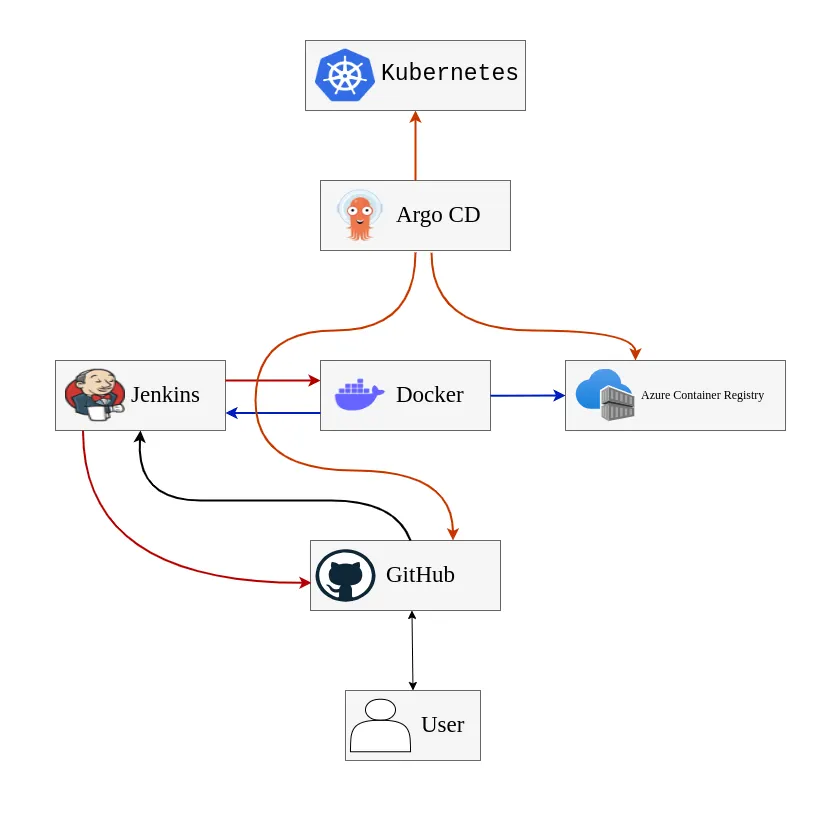
Architecture
Section titled “Architecture”The NCL application follows a microservices architecture, with each module deployed on Kubernetes. Each module runs in separate pods with replication enabled. The following tools are used for deployment and automation:
- GitHub: Centralized code management.
- Jenkins: Continuous Integration (CI).
- Docker: Building container images for various modules.
- Azure Container Registry(ACR): Centralized repository for storing module images.
- ARGO CD: Continuous Deployment (CD) to Kubernetes.
- Kubernetes: Platform for deploying and managing application modules.
- Windows_Based_Services_Deployments: Windows based services deployments.
- Monitoring: Monitoring through Nagios.
Deployment Strategy
Section titled “Deployment Strategy”GitHub
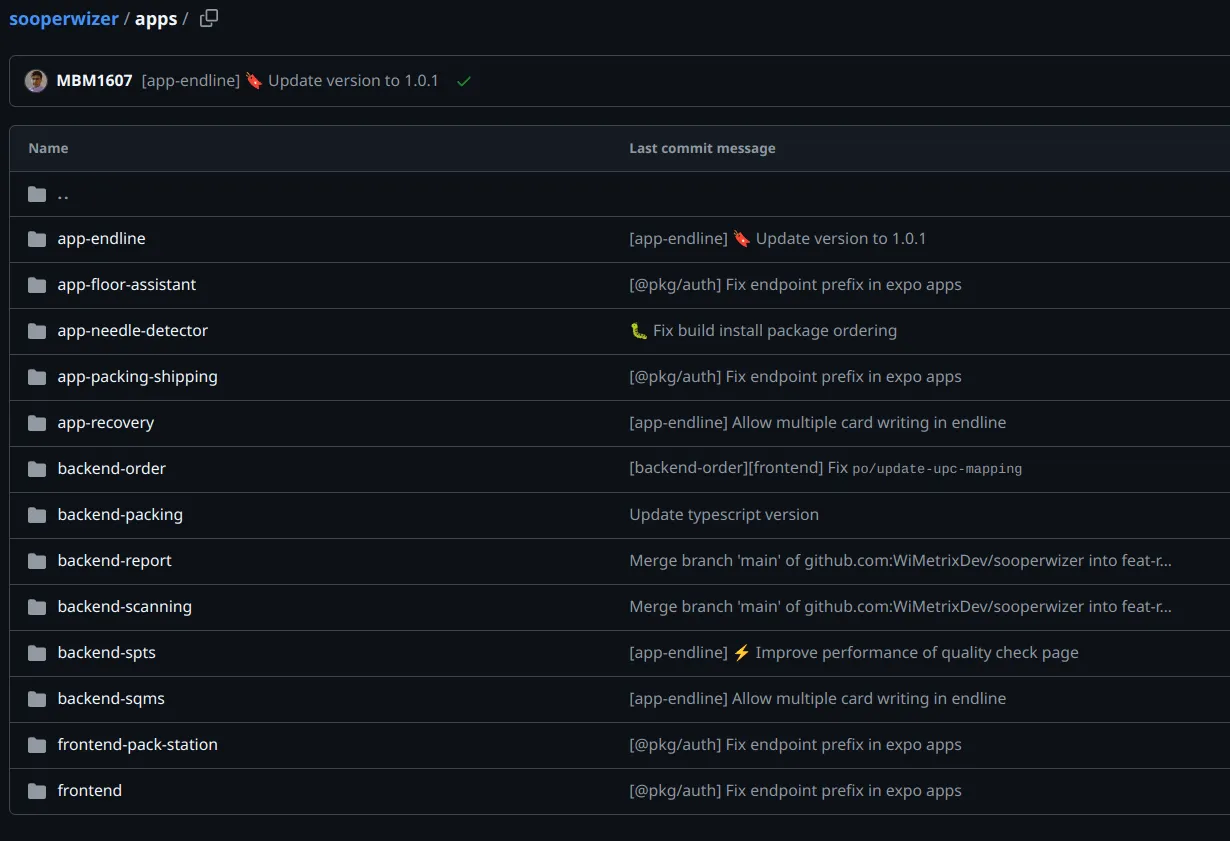
Section titled “GitHub”The source code is centrally managed in a GitHub repository named sooperwizer under the
WiMetrixDev organization. This monolithic repository includes both frontend and backend
code. The apps folder contains separate directories for each application module.
Jenkins
Section titled “Jenkins”Jenkins automates the deployment process through Continuous Integration (CI). Each directory in GitHub corresponds to a specific Jenkins job, which builds and sends container images to the Azure Container Registry (ACR). The pipeline in Jenkins consists of the following:
-
Incoming WebHook: A webhook from the
sooperwizerrepository triggers the Jenkins jobNCL-Sooperwizer-QAorNCL-Sooperwizer-Production, depending on the request header. Jenkins determines which job to trigger based on the reference header.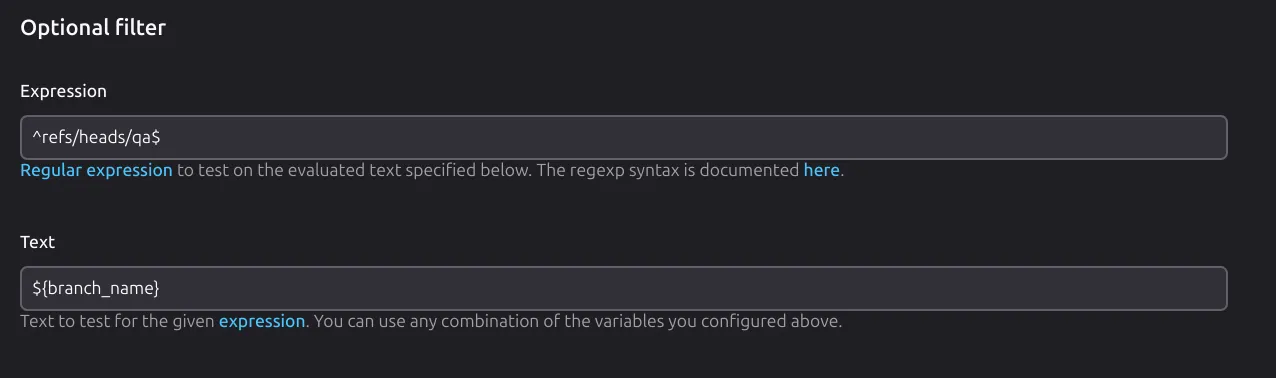
-
Jenkins Job Trigger: The main Jenkins job uses the
Dep-Sooperwizerrepository, which contains aJenkinsfiledefining steps to trigger specific jobs. This prevents all jobs from running unnecessarily. The stages include:- Repository Checkout: The job checks out the code from either the
qaormainbranch, depending on the request. - Duplicate Commit Check: It will check for the duplicate commit in case there is duplications in commit.
- Trigger Common Jobs: It will check if there is a change in common directories for frontend or backend to triggers multiple jobs at the same time.
- Trigger Single Job: If there is no change in common directories it will check for the every Job if there is any change it will trigger specific Job.
- Jobs Configuration: when the main Job decides which Jobs needs to be triggered it sends the command to trigger the Jobs in Jenkins with the parameters
Source branchandDEP branch. Means which branch the Job needs to fetch the code.
- Repository Checkout: The job checks out the code from either the
-
Job Configuration: Each Jenkins job corresponds to a repository (named with the prefix
dep) and uses its ownJenkinsfile,Dockerfile, anddeployment.ymlforArgo CD. The Jenkinsfile contains the following steps:- Environment Setup: Pulls environment variables from
Jenkins secretsfor use in the pipeline. - Checkout: Clones the relevant
DEPrepository on the Jenkins slave in a job-specific directory. - Build Docker Image: Then it will pass the environments to dockerfile with docker build command to build the image
- Push Docker Image: After building the Image it will push the Image to
Azure Container Registry(ACR). - Updating image tag in deployment manifest: It will update the image tag in
deployment.ymlfile so Argo CD will know that there is a new image available for deployment. - Push changes to Repository: After making changes it will push the change back to
DEPrepository.
- Environment Setup: Pulls environment variables from
Docker
Section titled “Docker”Docker is widely used for creating container images that encapsulate different components of an application. It is the most popular tool for containerization, allowing applications to run in isolated environments. Jenkins, a leading automation server, integrates with Docker to create and manage these container images, which can then be deployed to Kubernetes pods for efficient scaling and orchestration. Docker is deployed on the same machine as Jenkins to streamline the CI/CD pipeline.
- Container: A lightweight, standalone, and executable software package that includes everything needed to run a piece of software (code, runtime, libraries, and settings).
- Image: A snapshot of a container, representing a specific state of an application. Images are read-only and can be instantiated into containers.
- Dockerfile: A text file containing a series of instructions that Docker uses to build an image.
Azure Container Registry(ACR)
Section titled “Azure Container Registry(ACR)”Azure Container Registry (ACR) is a managed, private registry service in Azure that is used to store and manage container images. These container images are typically created using Docker in a CI/CD pipeline. ACR acts as a centralized location for storing container images, making it easy to share and deploy them across environments. Once the images are pushed to ACR, Argo CD can pull the images and deploy them to a Kubernetes cluster.
- Private Image Storage: ACR provides a secure, scalable repository for Docker images, Helm charts, and other container artifacts.
- Integration with Azure Services: Seamlessly integrates with Azure Kubernetes Service (AKS), Azure DevOps, and other Azure services for end-to-end container lifecycle management.
- Geo-Replication: ACR supports geo-replication to ensure images are available in multiple regions, reducing latency and improving deployment speed.
- Role-Based Access Control (RBAC): Leverages Azure Active Directory for fine-grained access control over the registry and its resources.
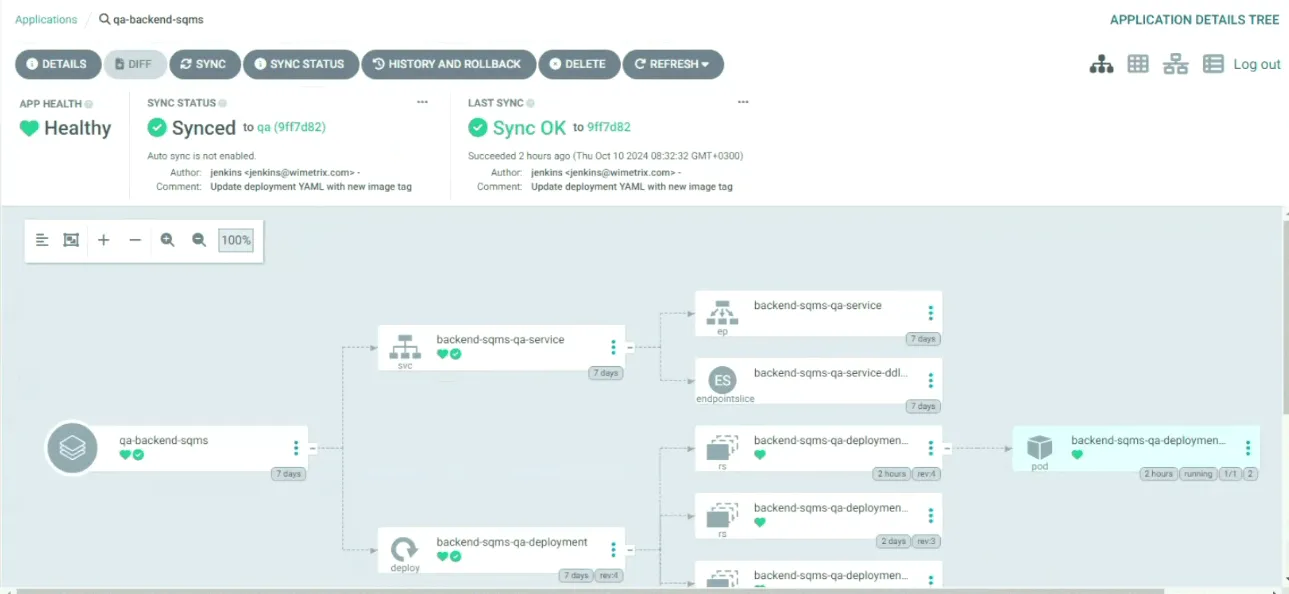
Argo CD
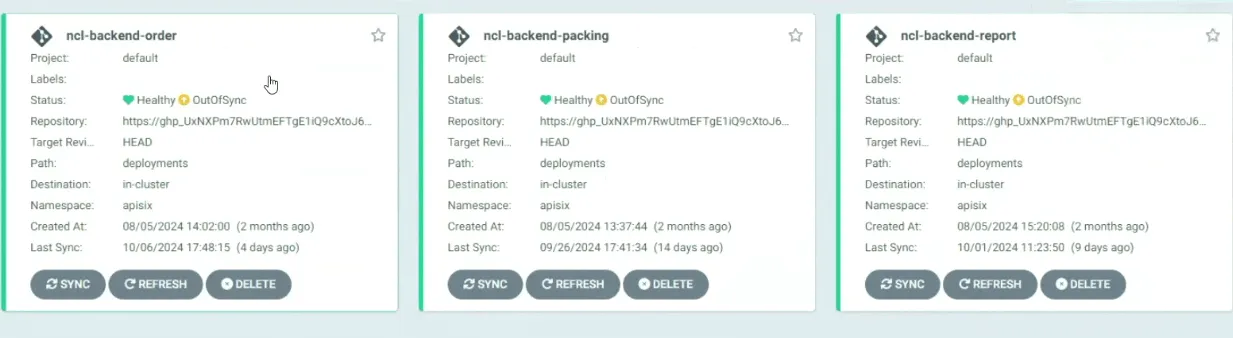
Section titled “Argo CD”Argo CD is used for Continuous Deployment (CD) to the Kubernetes cluster. It is configured to
monitor the current state and compare it with the desired state as defined in the GitHub
repository for each module. Argo CD ensures that the live Kubernetes environment matches the
state declared in the deployment.yml files.
-
Manifest Monitoring: Argo CD continuously monitors the deployment.yml manifest files stored in the GitHub repository. When a Jenkins job updates the
deployment.ymlfile after building a new image, the desired state of the application changes. Argo CD detects this change and highlights the difference between the current and desired states. -
Manual Syncing: After Argo CD identifies a change, users can manually trigger synchronization by clicking the “Sync” button. This pulls the latest container image from the Azure Container Registry (ACR) and redeploys the pods in the Kubernetes cluster with the updated image. This manual control allows teams to manage the timing of deployments, reducing the risk of unintentional changes.
-
Rollback Capability: One of the key advantages of Argo CD is its ability to quickly roll back changes. If a new deployment introduces issues, Argo CD allows you to easily revert to a previous version of the application by restoring the previous state from the repository. This can be done in just a few minutes, minimizing downtime and recovery time during incidents.
Kubernetes
Section titled “Kubernetes”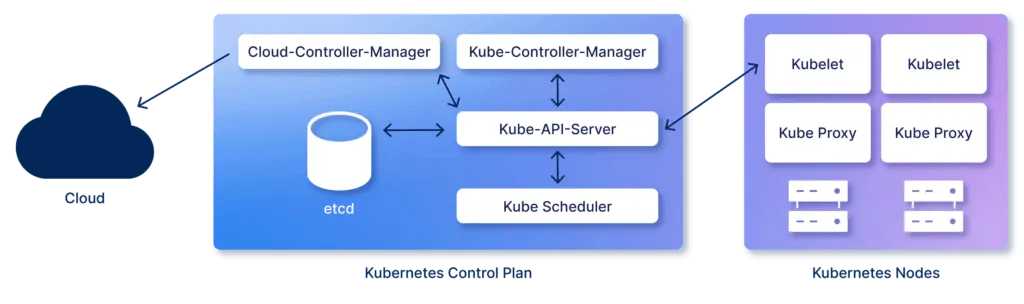
Kubernetes plays a key role in our deployment architecture, especially for managing our
microservices. Our current setup includes one Master Node and one Worker Node, with
multiple namespaces and pods within our Kubernetes cluster.
Namespace
Section titled “Namespace”- apisix
- argocd
- ingress-nginx
- qa
Pods by Namespace
Section titled “Pods by Namespace”- apisix:
apisix-dashboardapisix-mvvqlbackendbackend-orderbackend-packingbackend-packstationbackend-scanningbackend-reportbackend-sptsbackend-sqmsfrontendkeycloakncl-packncl-fe
- argocd
argocd-applicationargocd-applicationset-controllerargocd-dex-serverargocd-notification-controllerargocd-redisargocd-repo-serverargocd-server
- ingress-nginx:
ingress-nginx-admissioningress-nginx-admission-patchingress-nginx-controller
- qa:
apisix-dashboardapisix-mvvqlbackendbackend-orderbackend-packingbackend-packstationbackend-scanningbackend-reportbackend-sptsbackend-sqmsfrontendkeycloakncl-packncl-fe
- beta:
beta-backend-orderbeta-backend-packingbeta-backend-packstationbeta-backend-scanningbeta-backend-reportbeta-backend-sptsbeta-backend-sqmsbeta-frontend
This setup allows us to manage and deploy a variety of services and applications within isolated environments, optimizing resource allocation and scalability across our infrastructure.
Windows-Based Services Deployment
Section titled “Windows-Based Services Deployment”Microsoft SQL Server (MSSQL)
Section titled “Microsoft SQL Server (MSSQL)”-
Service Overview: Microsoft SQL is a database service to store data in the form of tables.
-
Pre-deployment Requirements: Windows operating system, Microsoft SQL server.
-
Installation and Configuration Steps:
- Backup and Disaster Recovery:
- Full Backup. Maintenance Plan is scheduled to take full backups every 8 hours. Full backups Older than 2 Weeks are automatically deleted from Main Server.
- Transactional Log Backup. Monitor transaction log growth and disk space utilization to avoid potential issues. Transactional log Backups for Production databases on Main Server. Customer is responsible for transition of Transactional log backups
- Backup and Disaster Recovery:
Monitoring
Section titled “Monitoring”Nagios
Section titled “Nagios”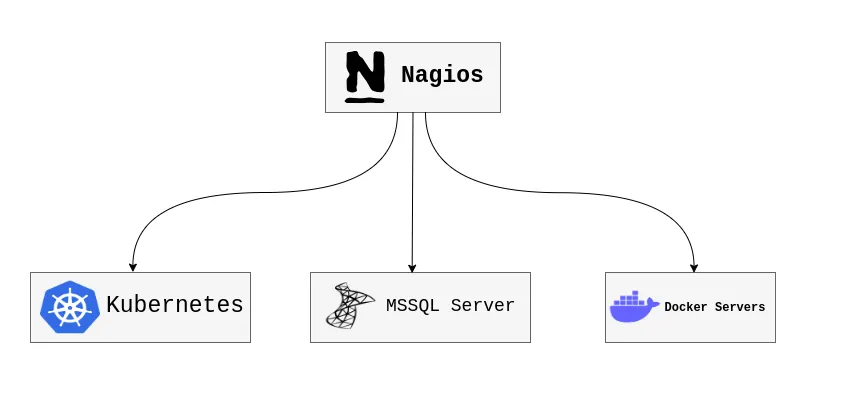
Nagios serves as the central monitoring solution for Kubernetes clusters, NCL servers, MSSQL database servers, and Docker environments. Acting as a comprehensive monitoring hub, it is deployed on a Linux machine, providing a unified view of system health and performance across different infrastructures. Custom monitoring services have been integrated into Nagios to allow for the tailored supervision of these varied environments, ensuring that key metrics are tracked and any potential issues are detected early.
Nagios excels in offering detailed insights into system performance by collecting logs, checking resource availability, and alerting on critical events like resource overuse or downtime. In this setup, it plays a vital role in maintaining the stability and reliability of the underlying systems.
Generic Method to Add Floor PC’s To Nagios Monitoring
Section titled “Generic Method to Add Floor PC’s To Nagios Monitoring”Nagios use custom configuration file linepcs.cfg to add new hosts in to Nagios monitoring. It ensures anyone on the team can perform host additions consistently.
For this purpose:
-
Login to the Nagios Server (
172.16.4.70). -
Go to the Configuration directory:
cd /usr/local/nagios/etc/objects. -
Open the file
linepcs.cfgfor editing using your preferred text editor (e.g. vim or nano). -
Add a new host block as follows:
define host {use linux-serverhost_name <HOST_NAME>alias <ALIAS>address <IP_ADDRESS>max_check_attempts 5check_period 24x7notification_interval 30notification_period 24x7}Replace
<HOST_NAME>,<ALIAS>, and<IP_ADDRESS>with the correct values.Define Services (Optional)
Add service definitions below the host entry if needed:
define service {use local-servicehost_name <HOST_NAME>service_description Execution Status Checkcheck_command check_execution_status!<arg1>!<arg2>!<arg3>check_interval 1retry_interval 1contact_groups devops-team-group} -
Ensure that
linepcs.cfgis included in/usr/local/nagios/etc/nagios.cfg:cfg_file=/usr/local/nagios/etc/objects/linepcs.cfgIf not present, add the above line.
-
Run the following command to verify the configuration:
/usr/local/nagios/bin/nagios -v /usr/local/nagios/etc/nagios.cfgCheck for any errors or warnings in the output.
-
If the verification is successful, restart Nagios to apply changes:
sudo systemctl restart nagios -
Open the Nagios Web Interface and confirm the new host appears and is being monitored.
LogStash
Section titled “LogStash”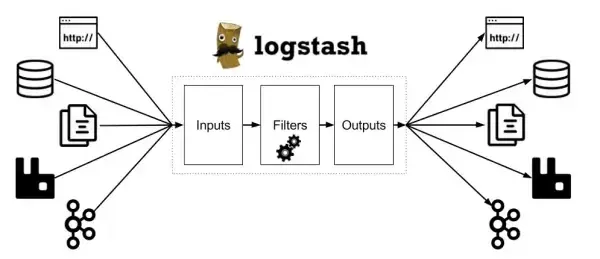
LogStash, a free and open-source server-side data processing pipeline, complements Nagios by handling log management. It is capable of ingesting data from multiple sources, transforming it as required, and forwarding it to a designated storage or monitoring platform, such as Elasticsearch. In this case, LogStash is also deployed on the Nagios server to streamline the collection and processing of logs across the monitored infrastructure. With LogStash in place, logs from Kubernetes, NCL, MSSQL, and Docker servers can be centralized and parsed for analysis, helping administrators quickly identify and troubleshoot issues.
Ansible
Section titled “Ansible”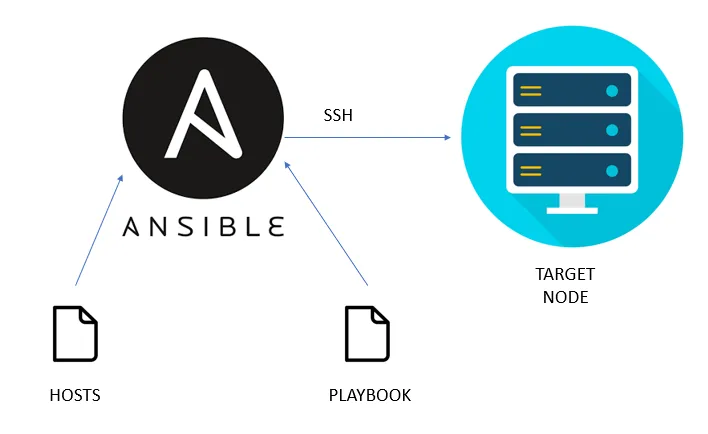
Ansible is another key tool in the infrastructure, designed for automation, software provisioning, and configuration management. As an open-source platform, it simplifies the process of managing complex infrastructures by using human-readable YAML files to define automation tasks. In this setup, Ansible is also installed on the Nagios server, serving as the tool that automates the deployment of Nagios plugins to new hosts. When a new host needs to be monitored, Ansible automates the installation of the necessary monitoring agents and configurations, enabling seamless integration into the existing Nagios monitoring system. This automation drastically reduces the time required for manual configuration and minimizes errors, ensuring that new hosts are properly monitored without delays.